


Anatomy Of A Data Stack
Data is all around us. In fact, according to Data camp for every grain of sand on earth, there are around 40,000 bytes of data. Finding, storing and sorting this data is a huge challenge for any organisation but crucial if they want to turn that data into smarter decisions.
What Is A Data Stack?
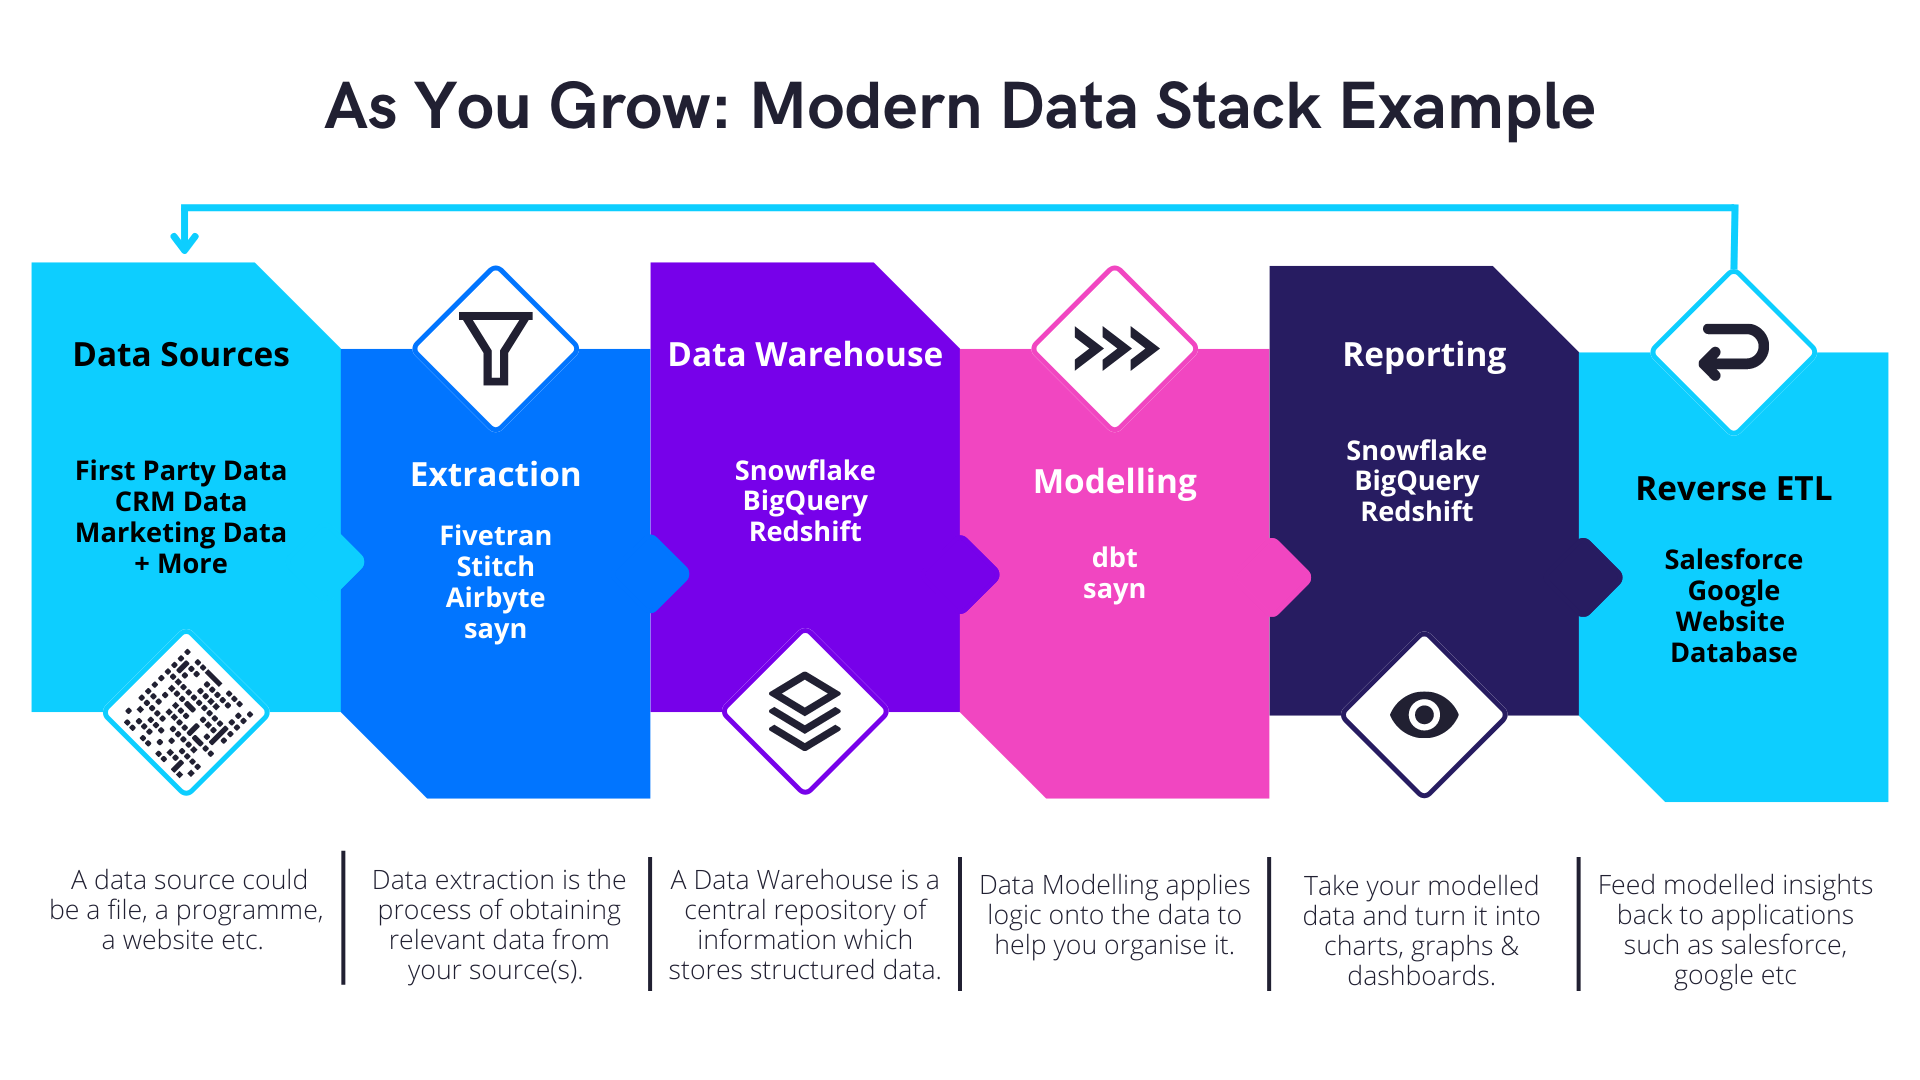
A data stack is essentially all the different tools you’ll use to organise, transform, visualise and analyse data. A data stack can comprise of many different elements and programmes and should be set-up to deliver the key information your business needs. There is no such thing as a ‘standard data stack’ but they are usually comprised of the following elements:
*Please note the tools used here are just for reference and 173tech is completely agnostic as to which tools we recommend to our clients.
Data Source
A data source is anything which produces digital information. Which in this modern world is pretty much anything! A data source could be a file, a programme, a website etc. Every organisation uses multiple data sources everyday, and often they have to combine metrics from multiple sources to get the answers they need.
Extraction Layer
Data extraction is the process of obtaining relevant data from your source(s). It sounds simple but not all data sources are neat and tidy! They can be both complex in nature and poorly documented, which means that determining which data needs to be extracted can be difficult. Another issue is understanding when the data source will update, many assume that all data is generated in real time, which is often not the case! For example, if you need hourly updates on sales, but your payment service only update every three hours, you could have inconsistencies throughout the day. Typically you cannot edit the data source itself, which means you can only extract the data that is available, at the time it’s available, in the format it’s available. Don’t worry though, as once you’ve extracted the data, you will be able to model it in the format you require later.
While there are certainly technical challenges to extracting the right data at the right time, probably the biggest challenge clients have is understanding which data is really important to them! Too many companies are guilty of trying to extract everything and quite quickly can’t see the woods for the trees. We have worked alongside businesses of all sizes and can help advise which metrics fuel real growth.
Data Warehouse
All of the data you extract has to live somewhere. A Data Warehouse is a central repository of information which stores structured data. Your data warehouse might be on your premises or on the cloud. The ideal scenario is of course to have one central data warehouse for everything but even large organisations struggle to achieve this. Warehouses are different from Data Lakes in that Data Warehouse specifically deals with structured data (i.e. data that you are ready to use and is formatted) where Data Lakes can also accommodate unstructured data (i.e. in its original format).
Modelling Layer
Data Modelling transforms the information from your extracted source into a format useful to your business. It applies logic onto the data to help you organise it. That might mean for example that you take two metrics from different data sources and organise them in such a way that they can be compared like-for-like. Modelling your data will enable you to:
- Easily consume and investigate data from multiple angles, e.g. CAC, CLV, ROI, conversion rates by product, marketing channel, campaign creative and more.
- Centralise and align metrics across your services.
- Apply logics specific to your business.
Creating data models is one of the more complex and time consuming tasks when putting together your data stack. One data model can easily have 200 lines of logic associated with it, all of which need to be reconciled. Doing this diligently takes time.
Data Science Layer
Data Science could be considered a more advanced/complex version of Data Modelling. A lot of the time you are looking at historical data sets to understand the relationship between that information and then use it to make predictions about the future. Data Science relies on Machine Learning for these more complex calculations. As an example you might you create a model that predicts how likely a customer is to leave by looking at what actions all your other customers took before leaving. You would then use Machine Learning to train that model so that as more data becomes available, its predictions get more accurate.
Analysis Layer
Where most ‘business users’ will rely on dashboards and charts to understand their data at a top level, the Analysis layer is where you can deep-dive into specific topics in much greater detail. It’s typically used by Data Analysts who are looking for robust answers to business questions as opposed to many of the ‘day-to-day’ metrics which might be surfaced in a dashboard.
Reporting/Visualisation Layer
This is the layer that most users will be familiar with. Here you are taking your modelled data and turning it into charts, graphs and dashboards which make information easy for the end user to understand. While many people are familiar with dashboards, there is an art to creating a great one. A good dashboard should be confident in it use of visualisations, allowing you to compare and investigate metrics easily. It should provide context as to whether the number is good, bad or unusual and where possible we would also recommend creating automated alerts for any key actions that need to be taken.
Conclusion
This is the layer that most users will be familiar with. Here you are taking your modelled data and turning it into charts, graphs and dashboards which make information easy for the end user to understand. While many people are familiar with dashboards, there is an art to creating a great one. A good dashboard should be confident in it use of visualisations, allowing you to compare and investigate metrics easily. It should provide context as to whether the number is good, bad or unusual and where possible we would also recommend creating automated alerts for any key actions that need to be taken.